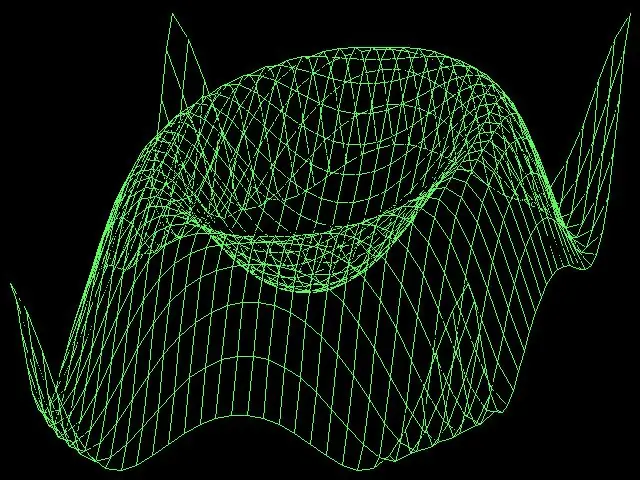
The Turbo Pascal programming language allows you to graphically draw various shapes on the screen. Any graphic object can be constructed using points, lines, arcs. Pascal uses a raster graphics mode with a screen resolution of 640 x 480. Drawing consists in setting the coordinates of the start and end points of the object to be displayed to the graphic procedures. The color of the object, the thickness of the lines, as well as their style, are also specified as parameters of the graphic procedures. To draw using software, you need to connect the Pascal graphics module.

Necessary
Turbo Pascal programming environment
Instructions
Step 1
Disassemble the specified drawing object into its constituent elements. Select individual lines, arcs, circles, rectangles, and points. These are the shapes that can be drawn using Turbo Pascal procedures.
Step 2
At the very beginning of the program code, connect the graphics module. To do this, write down a line like this: uses graph. Next, create integer variables to initialize graphics mode: var gdet, gm: integer.
Step 3
In the body of the program, after the begin keyword, initialize the variables, assigning one of them a zero value, and the second the value of detect. Next, specify the start of the graphical drawing mode, enter a line like: initgraph (gdet, gm, ''). Clear the display device: cleardevice.
Step 4
Set the background color for drawing and the line color of the objects to be drawn. Use the procedures SetBkColor (white) and SetColor (8) for this. The color to be set is indicated in brackets. In total, Pascal uses 16 colors, and each of them is specified either by a number or by a word from a special color table.
Step 5
Imagine a screen graticule with the x-axis from left to right and the y-axis from top to bottom. At the origin of this coordinate system, that is, in the upper left corner of the screen, is the coordinate (0, 0). Calculate the coordinates of the desired position of the first graphic object. Specify all coordinates for drawing figures in this particular system.
Step 6
Draw a line using the procedure line (x, y, x1, y1), where coordinates x, y are the starting point of the line, and x1, y1 is its end. Change the line thickness or type if necessary. To do this, use the SetLineStyle (0, 0, NormWidth) procedure. The first parameter of the procedure can change the line by making it a dash, or a dotted line - change this number to 1 or 2. The third parameter sets the thickness of the lines. By default the NormWidth parameter is always set - thin lines, for thick lines set ThickWidth. The changed line type will be drawn after calling this procedure.
Step 7
Put a point on the screen using the PutPixel (x, y, color) procedure, here x and y are also the coordinates of the point, and color is its color. Before drawing a closed shape, you can set its fill. To do this, call the SetFillStyle (EmptyFill, 0) procedure, where the first parameter specifies the solid fill of the shape, and the second specifies the fill color.
Step 8
A rectangular shape is drawn using the Rectangle (x, y, x2, y2) procedure - the coordinates set the upper left and lower right corners of the shape. To draw a circle, write the line Circle (x, y, R), where x, y, R are the coordinates of the center and the radius of the circle, also in pixels. An ellipse is more difficult to draw, many more parameters are used for this: Ellipse (x, y, BegA, EndA, RX, RY). Here x, y is the same center of the ellipse, and BegA and EndA indicate the angle at which to start and end the elliptical arc. The variables RX, RY set the radius of the ellipse along the x and y axes, respectively.
Step 9
If you have a given shape, which is easiest to draw in separate segments, use the MoveTo and LineTo procedures for this. First, move the current cursor to the point you want: MoveTo (x, y). Then draw a line from it to the next point LineTo (x1, y1) and again draw a straight line LineTo (x2, y2) and so on until you get the original shape.
Step 10
At the end of drawing in the program code, close the graphics mode with the line: closegraph. End the body of the program, as usual, with the word end. Now the code can be compiled and run for execution.


